 |
Chris Bell | 'A business that makes nothing but money is a poor business.' |
| - Henry Ford |
 |
Chris Bell | 'A business that makes nothing but money is a poor business.' |
| - Henry Ford |
SNHU - IT-415 Advanced Information Systems Design
Written by: Chris Bell - May, 2014
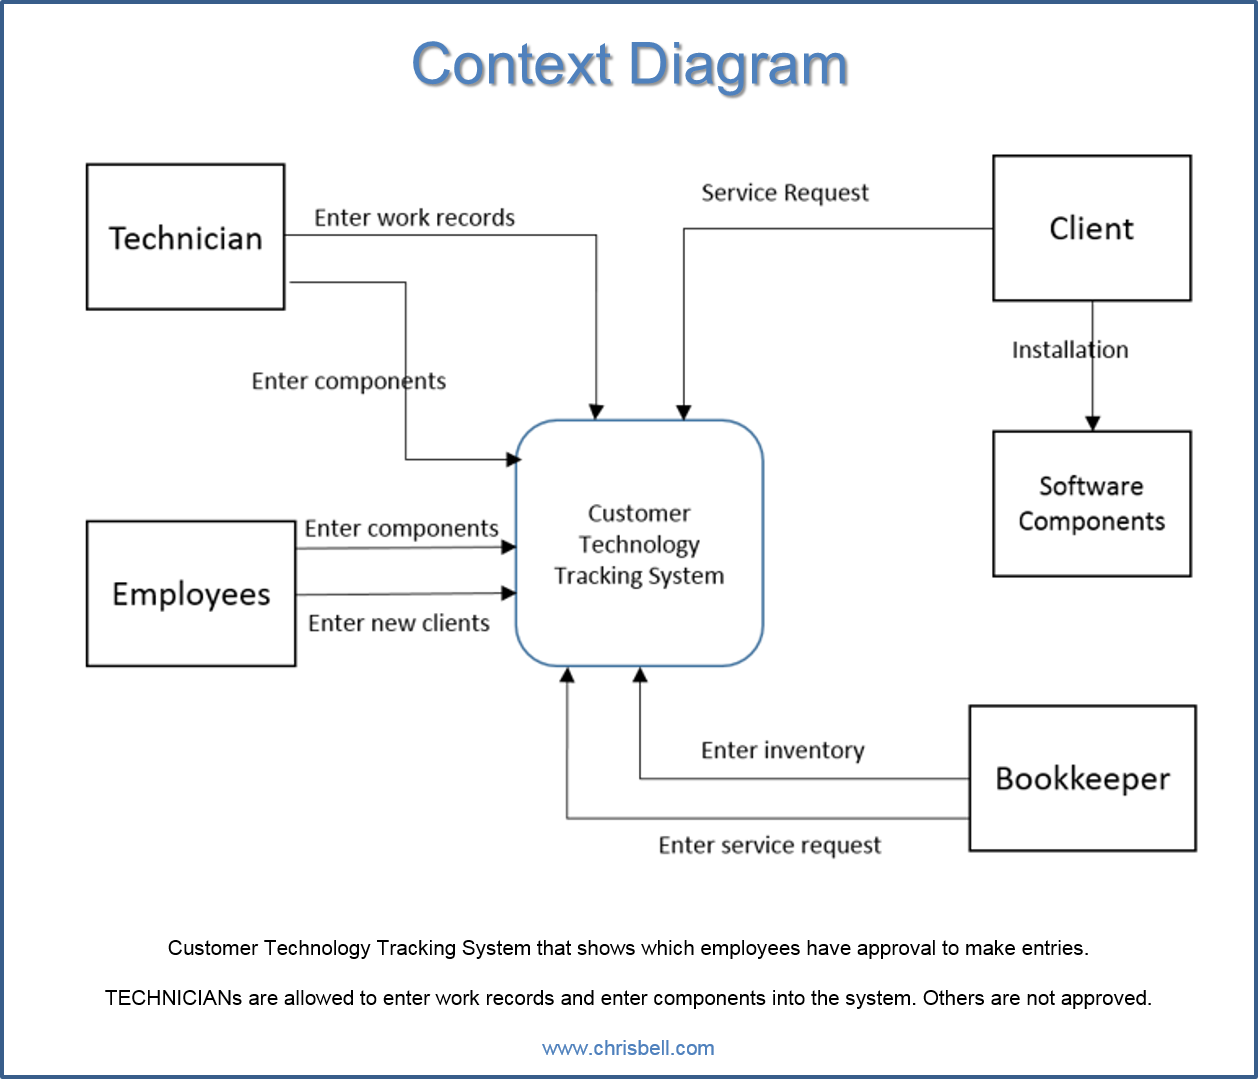
There is a customer technology tracking system below for a fictitious company that services customers with software components. The context diagram is telling the programmers how the system should act when each different user, or Actor, is using it. For instance, the Technician should be able to enter work records and components, but not service requests or inventory. Each diagram has a unique purpose that makes it easier to understand for the next portion of the information system construction.
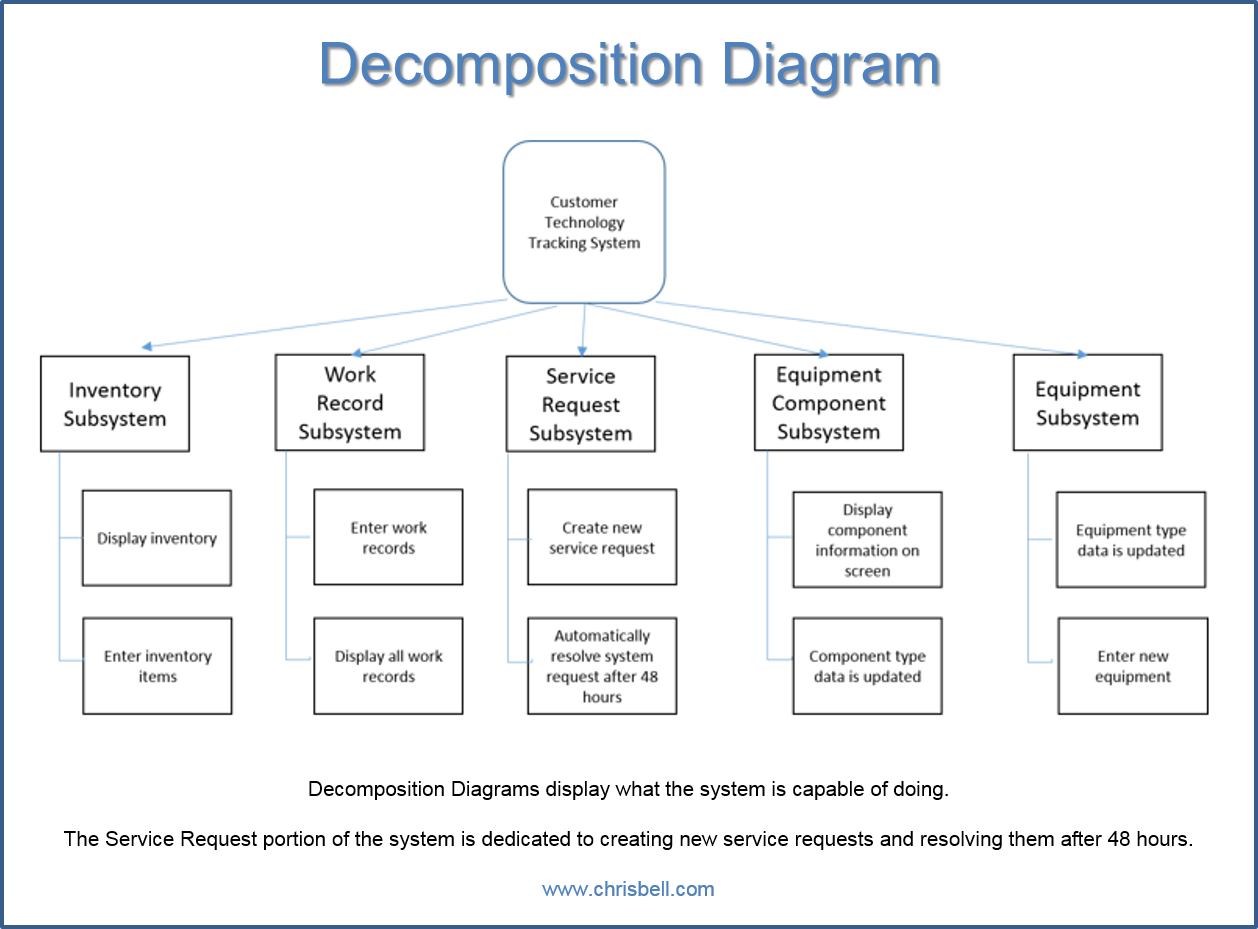
The customer technology tracking system will be broken into a few different sections, and the customer will help determine what they want displayed when each section is entered. The middle block points to the service request portion of the system which is going to input the service request to the technician and automatically delete after the technician accepts it into their queue.
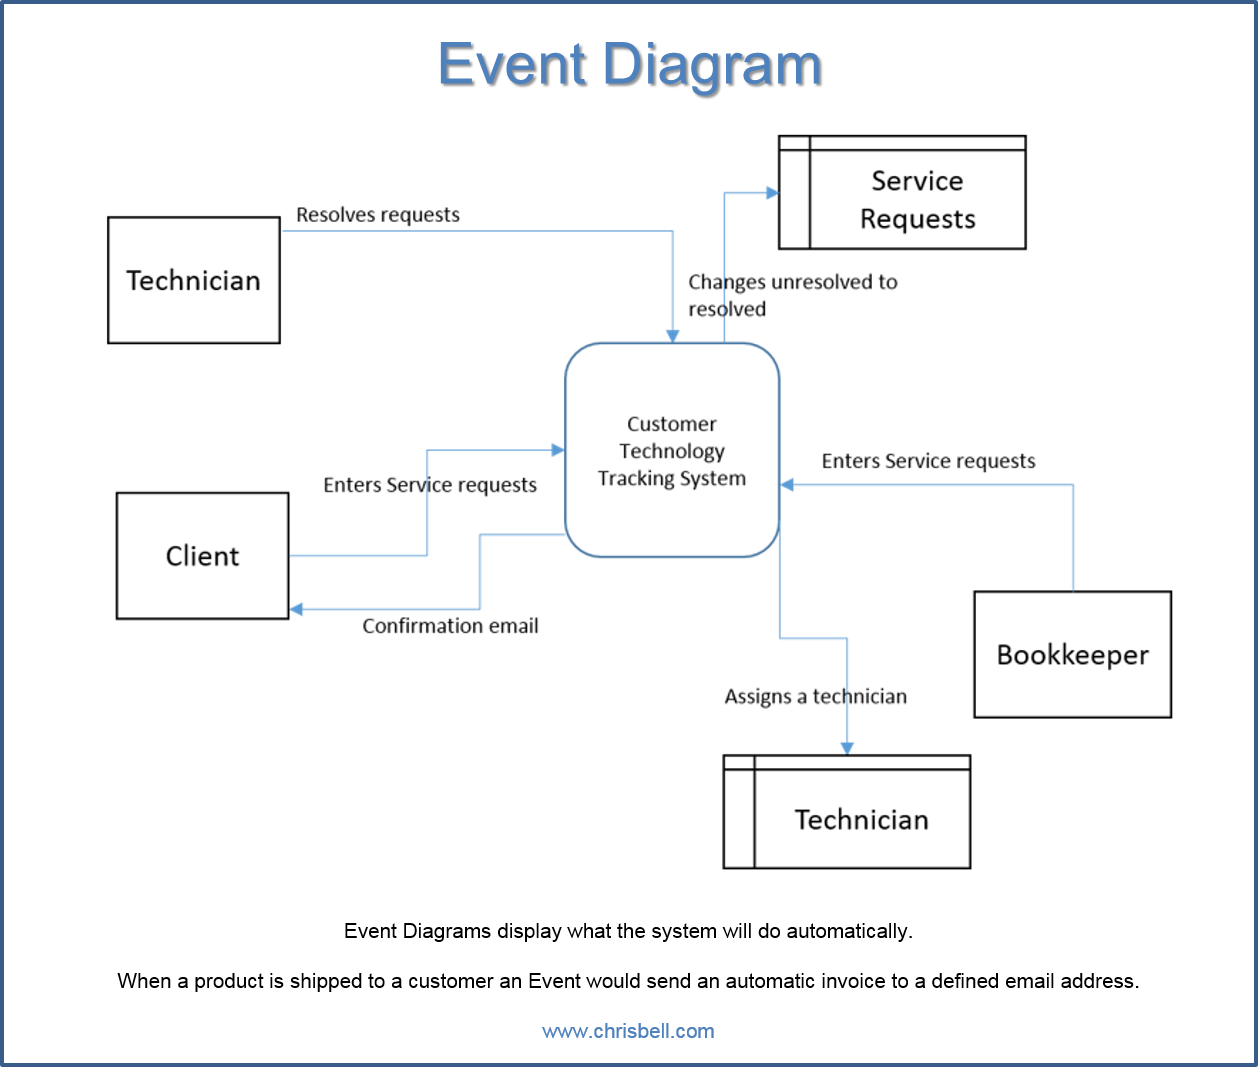
Events in a technology information system describe what the computer does after a certain prompt. An example of an event is receiving an automated email confirmation after placing an order online. The system generates the email based on input information from the user along with some generic information. Below, the diagram shows how the system will react once an service request is entered, and in this case, the system assigns the request to a technician. After the technician fulfills the request, he or she is responsible for resolving the request sitting in the system queue.
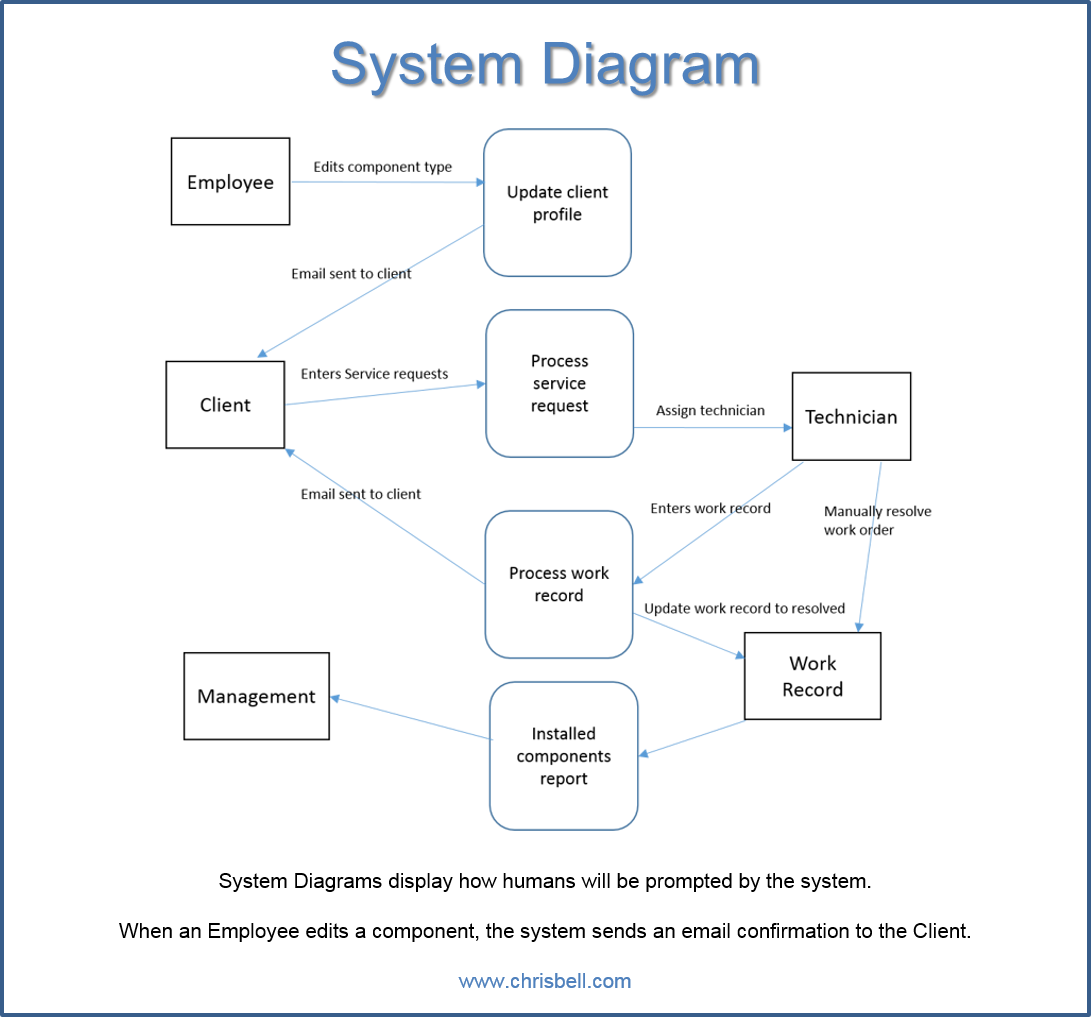
The system diagram is similar to the event diagram because it shows how the system reacts to prompts, however the system diagram is meant to show the entire flow of a process with a clear ending point. In this case, you can follow the arrows through the process and understand how the company will process new inventory items, service requests, technician appointments, and so on. If the system doesn't make the next move, who does? It's a good idea to set your information system to prompt your employees as often as possible because people forget things.
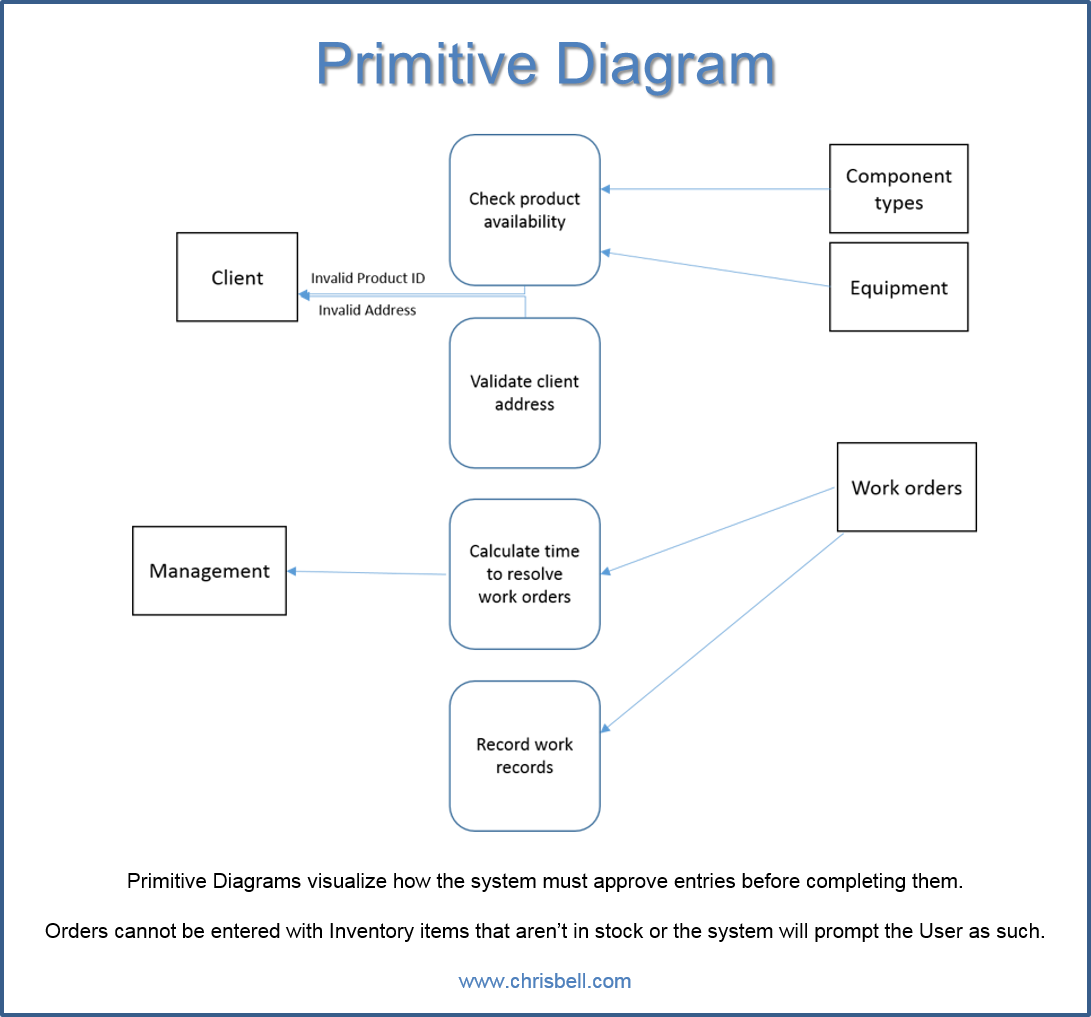
The primitive diagram shows calculations and instructions that the system needs to follow, which is more than a simple prompt from above. When work orders are entered the sytem calculates the date-entered to the date-resolved and sends the statistics to management for review. Also, when the customer tries to enter a work order the system checks to see if the product is in stock. If it is there's a prompt, and if it's not there's a different prompt. In this case, the customer will be notified that there is, or isn't stock available to fulfil their order.
References:Whitten, Jeffrey L., & Bentley, Lonnie D. (2007). Systems analysis and design methods, 7th edition. Boston, Mass.: McGraw Hill. |